
“I saw this LED bar-graph on the Pimoroni site and thought it might be an inexpensive and fun project while undertaking covid-19 lockdown.
It contains 24 LEDS, a red and a green, in each of its 12 segments, so in theory you should be able to display red, green and yellow. Normally you would expect 2 anodes, one for red and one for green, and 24 cathodes if you were building it out of 24 LEDs. This package only has 14 pins and three pairs of pins are connected internally!
How do you drive 24 LEDs with only 11 pins? This looked an even more interesting project.
- We will have to make use of the persistence of vision in the eye and flash the various LEDs very fast.
What do I want to be able to do with it?
- Move a single red, green or yellow light back and forth along the display
- Display a red, green or yellow left-aligned bar along the display
How can I supply a simple input to change the display?
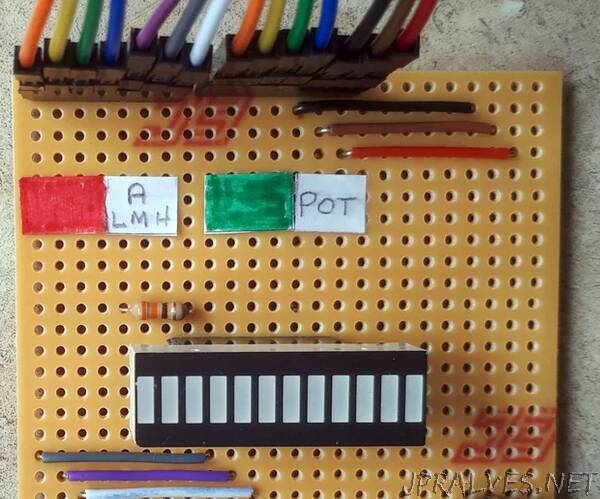
- Use a 10K potentiometer to generate values from 0 to 12 inclusive.
I decided to use an Adafruit ItsyBitsy M4 Express for this project and program it using CircuitPython. This is a 3.3V device so I decided to put 330 Ohm resistors on the anodes to keep the current down and protect the microcontroller pins and the LEDs. Im only going to light a maximum of two LEDs at any moment a red and green LED in the same segment to obtain yellow.”