
“Can WS2812-strips change their colors with the speed of light? No, not really. But can you watch the transmission of data? Yes, you can!
Fans of WS2812 strips are happy as soon as their application works as intended. But do they ever check how things work internally? This is to show a way how to analyze the transmission of data using a minimum of additional components.
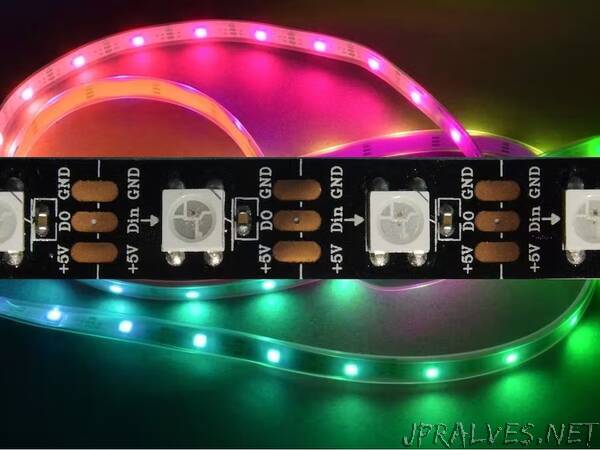
We are using the common strips offering 60 LEDs each. First of all, you need one Arduino (called sender) to produce a string of data to be sent to strip-1. Obviously, it is not easy to connect jumper wires to the small copper parts between adjacent LEDs.
The outgoing data produced by the sender as well as the data fed from the last LED of strip-1 to the first LED of strip-2 and the data fed from the last LED of strip-2 to the first LED of strip-3 and (if available) the outgoing data of strip-3 are sampled by a second Arduino (called analyzer) using pins of the same port (Port B in this case) which makes sampling much easier and faster.
The job of the analyzer program is to wait for the start of the stream of data, then sample as much as the Serial Plotter can hold (500 samples) and finally present the data. This program can also measure the time to read these 500 samples.”