
“For quite some time I entertained the thought of having a wall-sized world map. Maybe it started when I read the blog post by Dominik Schwarz about his map, maybe a bit earlier. Exactly as Dominik I soon realized it’s really hard to buy a map which is neither ugly nor has a low resolution/amount of details.
There are a few maps I enjoy visually and probably on the top of the list is the bathymetry map of Heezen and Tharp, drawn by Heinrich Berann. While the sea floor depth data itself is accurate and this is meant to be a scientific documentation, the map and its status as an art object benefits a lot from the artists execution.
However, the process of getting from information to image involves in this case a manual artistic process. This is especially visible when having a look at the continental shelf.
I for one would prefer something a bit more automatic, after all I am not a professional illustrator. Like all things in life, something is considerably more complicated the closer you look at it and this is true for the process of turning geo-info into a map at a certain zoom-level. Here is a nice blog post reflecting on how much better Google Maps handles all these intricate details compared to other map software.
I experimented a bit with different map data sources, thought about inkjet printing and wrote a script to scrape google maps tiles and stitch them. That works kinda okay-ish, but the the classic Google Maps style did not really fit. For OpenStreetMaps you can find different map styles, the most beautiful (at least in my opinion) of those is Stamens Toner.
But using either google maps or Stamen’s Toner OSM tiles, this would basically result in me trying to print the largest image possible. But maybe Inkjet printing is not the best way to move forward. So, given our means of production how can we get a really large wall-sized world map? I did built some drawing machines (pen plotters) in the past, so why not do that?…
Data:
First step: how to get the data? Best data source is OpenStreetMap. No discussions. However, a dump from the OSM DB (the planet-file) is a whopping 50GB (compressed) and 1200GB uncompressed! Whew… No. Luckily, there are already pre-processed extracts for certain features and that’s all we need. Namely the land- and water-polygons, the coastline, a selection of cities including meta-data (population) and … the ocean floor depth. Luckily one doesn’t need to scrape Digital Terrain Model data by hand, but can rely on GEBCO.
On a glance:
Coastlines from OpenStreetMap
Land and water polygons are shapefiles from Natural Earth
Bathymetry (ocean depth) from GEBCO
Main problem: when working with pen plotters, we don’t deposit tiny droplets of ink based on pixel data, but draw lines with pens, based on vector data described as coordinates. So our whole image is basically just a gigantic assortements of lines. Drawing maps with pixels has one huge advantage: you can overwrite pixels. You draw the oceans, on top of that the land, on top of the land the streets, etc. When using pens and lines, you see if there is a line underneath the line underneath another line.
So when processing each polygon on each layer needs to be subtracted from all underlaying layers, repaired, simplified and written to an SVG file. That took me a while to figure out. Luckily there is Shapely, an incredibly well working python library for polygons. After creating a map, all the lines need to be sent to the pen-plotter in a order that makes sense. Drawing with the pen is quite fast, but lifting the pen to move to the start of the next line is extremly slow compared to drawing. So main objective is to optimize the pen’s path to minimize pen lifting movements and the travel distance in-between lines. Luckily, a long time ago, when starting to study computer science there is usually a course like “Introduction to Algorithms and Data Structures” (which almost all freshmen hate). The problem of “walking” along a certain set of streets in between cities (line start and end points) while taking the shortest route is the Chinese Postman Problem. So what’s the minimum number of edges that need to be added to graph to traverse the graph on the shortest route while visiting every node exactly once? Yeah, now do that for two million nodes…
Ok, it worked well for smaller graphs but in the end it was very little fun to optimize my crude implementation of an algorithm solving this problem and I dropped it. The greedy approach, however, did work well: draw a line, check which line’s start or endpoint is closest to the current position and draw that line. That seemed to be about 10 percent slower than the almost optimal solution, but heck, I just want to have something working well enough to get it done.
Hardware:
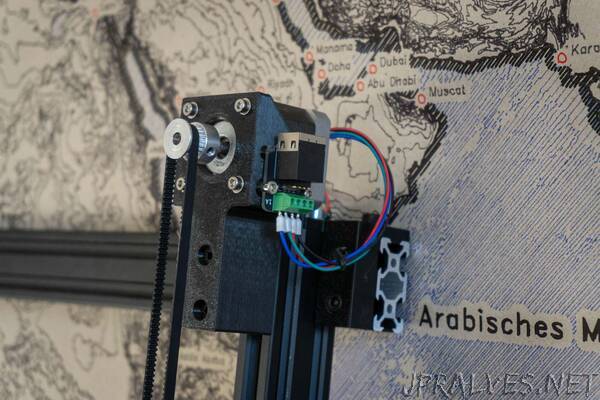
When I started building the plotter quite a while ago I was rather concerned about the size of the machine and how I could stow it efficiently. The plotter is made from Openbuilds V-Slot and 3D-printed connection elements. It’s a rectangle with belts in CoreXY-configuration and when removing the belts and undoing 2 screws per corner the plotter can be disassembled in a matter of minutes.
Popular plotter designs (Axidraw) commonly use small servos to move the pen up and down. That’s inexpensive and totally suitable for something like lifting a pen but the sounds the servo generates are extremly nasty. When using a pancake stepper and some decent drivers, the plotter is almost silent.”