
“How to sample with High Speed ADC and DAC in FPGA and perform signal processing on the received signal.
Introduction
Programmable logic is great for signal processing thanks to its parallel nature. This means we can implement different processing stages at the same time from reception to filters and FFT.
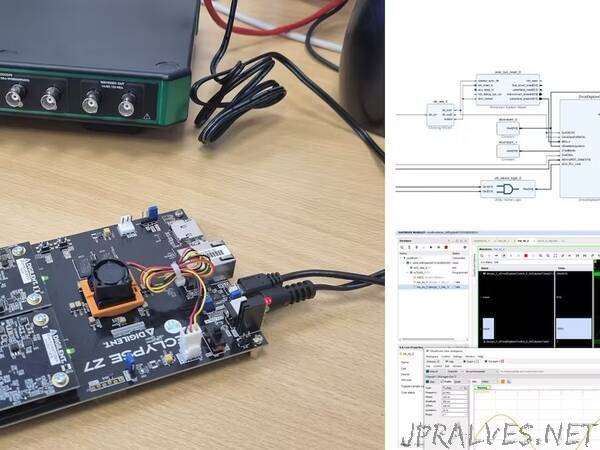
In this project we are going to take a look at how we can use the Digilent Eclypse Z7 board along with the Zmod AWG and Zmod digitiser to implement a signal processing chain.
Unlike when we have done this in projects in the last we we will be focusing entirely on the PL and explaining the design decisions which go into the filter design also. My object is not just to show how the to create this project but for you to understand why it works also.
For this project we are going to be using Vivado 2022.2
Filters Introduction
Filters can be implemented very simply from a simple RC filter to more complex but still pretty simple active filters based around operational amplifiers e.g Sallen-Key. Indeed one of engineers first introductions to filters might be in the analog domain.
However, implementing filters in the digital domain if the ADC / DAC input bandwidth is wide enough offers several benefits. This includes frequency responses which would be difficult implement using analog methods and of course no drift of aging on passives, ease of modification and update in the field etc.
As any engineer will be aware there are four main types of filter; Low Pass which only allow signal below the predetermined cut off frequency. High Pass filters are the inverse of the Low Pass and will only allow frequencies above the cut off frequency through. Bandpass filters only allow through a pre determined bandwidth of frequencies preventing other frequencies. The final type of filter is Bandstop which is again the inverse of the Bandpass filter and therefore rejects a predetermined bandwidth while allowing all others to pass through.
Most basic digital filters are implemented in one of two methods Finite Impulse Response and Infinite Impulse Response, as you can see in this project we are implementing a FIR Filter.
The main difference between the two types of filter is the presence or lack of feedback, the absence of feedback within the FIR filter means that for a given input response the output of the filter will eventually settle to zero. An Infinite Impulse Response filter however, which does contain feedback will have a non-zero response.
The lack of feedback from the filter technology allows the FIR filter to be inherently stable as all of the filters poles are located at the origin.
If you where to asked to draw a diagram of the perfect low pass filter you would most engineers would draw a similar figure to that shown below.
The frequency response shown above is often called the “brickwall” filter as the transition from pass band to stop band is very abrupt and much sharper than can realistically be achieved, the frequency response also exhibits other “perfect” features such as the no pass band ripple and perfect attenuation in the stop band.
If you where to extend the diagram shown above such that it was symmetrical around 0 Hz extending out to both +/- FS Hz and performed a Inverse Discrete Fourier Transform (DFT) upon the response you would obtain the impulse response as shown below
This is the time domain representation of the frequency response of the perfect filter shown above. It is from this response that FIR or windowed SINC filters get their name as the impulse response is what is achieved if you plot the SINC function
Combined with the step response of the filter, these three responses— frequency, impulse and step—provide all the information on the filter performance you need to know to demonstrate that the filter under design will meet the requirements placed upon it.
Frequency Response
The frequency response is the traditional image engineers consider when thinking about a filter. It demonstrates how the filter modifies the frequency domain information. The frequency response allows you to observe the cutoff frequency, stopband attenuation and passband ripple. The roll-off between passband and stopband—often called the transition band—is also apparent in this response. Ripples in the passband will affect the signals being filtered. The stopband attenuation demonstrates how much of the unwanted frequencies remain within the filter output. This can be critical in applications where specific frequency rejection is required, for example when filtering one frequency-division multiplexed channel from another in a communications system.
ImpulseResponse
It is from the impulse response that the coefficients for your filter are abstracted. However, to achieve the best performance from your filter, the standard practice is to use a windowing function. Windowing is the technique of applying an additional mathematical function to a truncated impulse response to reduce the undesired effects of truncation. The figures above demonstrates the impulse response extending out infinitely with ripples which, though they diminish significantly in amplitude, never settle at zero. Therefore, you must truncate the impulse response to N + 1 coefficients chosen symmetrically around the center main lobe, where N is the desired filter length (please remember that N must be an even number). This truncation affects the filter’s performance in the frequency domain due to the abrupt cutoff of the new, truncated impulse response. If you were to take a discrete Fourier transform (DFT) of this truncated impulse response, you would notice ripples in both the passband and stopband along with reduced roll-off performance. This is why it is common practice to apply a windowing function to improve the performance.
StepResponse
The step response, which is obtained by integrating the impulse response, demonstrates the time-domain performance of the filter and how the filter itself modifies this performance. The three parameters of importance when you are observing the step response are the rise time, overshoot and linearity. The rise time is the number of samples it takes to rise between 10 percent and 90 percent of the amplitude levels, demonstrating the speed of the filter. To be of use within your final system, the filter must be able to distinguish between events in the input signal; therefore, the step response must be shorter than the spacing of events in the signal. Overshoot is the distortion that the filter adds to the signal as it is processing it. Reducing the overshoot in the step response allows you to determine if the signal distortion results from either the system or the information that it is measuring. Overshoot reduces the uncertainty of the source of the distortion, degrading the final system performance, and possibly means the system does not meet the desired performance requirements. If the signal’s upper and lower halves are symmetrical, the phase response of the filter will have a linear phase, which is needed to ensure the rising edge and falling edge of the step response are the same. It is worth nothing at this point that is very difficult to optimize a filter for good performance in both the time and frequency domains. Therefore, you must understand which of those domains contains the information you are required to process. For FIR filters, the information required is within the frequency domain. Therefore, the frequency response tends to dominate.
Windowing the Filter
Using a truncated impulse response will not provide the best-performing digital filter, as it will demonstrate none of the ideal characteristics. For this reason, designers use windowing functions to improve the passband ripple, roll-off and stopband attenuation performance of the filter. There are many window functions that you can apply to the truncated sinc, for example Gaussian, Bartlett, Hamming, Blackman and Kaiser—the list goes on. However, two of the most popular window functions are the Hamming and Blackman. Let’s explore them in more detail. Both of these windows, when applied, reduce the passband ripple and increase the roll-off and attenuation of the filter. The figures below shows the impulse and frequency responses for a truncated sinc, and with Blackman and Hamming windows applied. As you can see, both windows significantly improve the passband ripple. The roll-off of the filter is determined not only by the window but by the length of the filter—that is, the number of coefficients, often called filter taps.”