
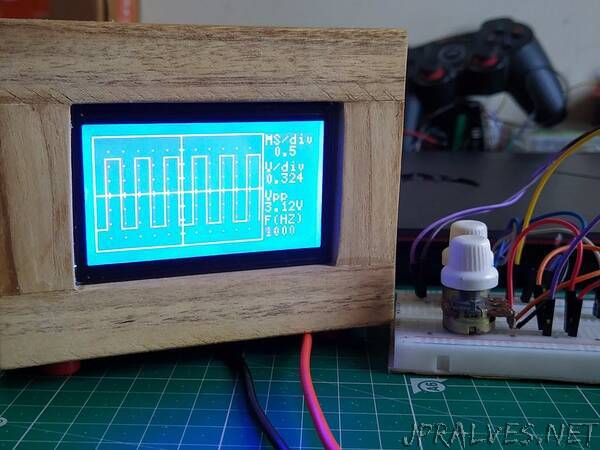
“It’s a handy little gadget that draws charts automatically using signals you feed into it from the probes hooked up to an electronic circuit.
Overview
You’ve almost certainly drawn charts in school. Many of them show how a certain quantity of something (like a heart rate, the price of a corporation’s shares, or a country’s exchange rate) changes over time. They have the quantity plotted in the vertical direction (known as the y-axis) and the time period plotted in the horizontal direction (the x-axis).The trouble with charts like this is that they can take ages to plot—unless, of course, you happen to be an oscilloscope!”