
“A simple interface to monitor my raspberry pis (headless) and my laptop thanks to MQTT and Node Red
Story
Happy owner of a pihole based on a Raspberry Pi zero W and a Raspberry Pi 4 which is used as a server for several purposes (owncloud, MQTT broker, back up of my laptop…) I wanted to be able to easily monitor them with a webbased interface.
So I chose to develop the following solution :
Each board or laptop is running a python script which gather information such as cpu speed, core temperature, disk usage… and compact them into a json message send them to my MQTT Broker
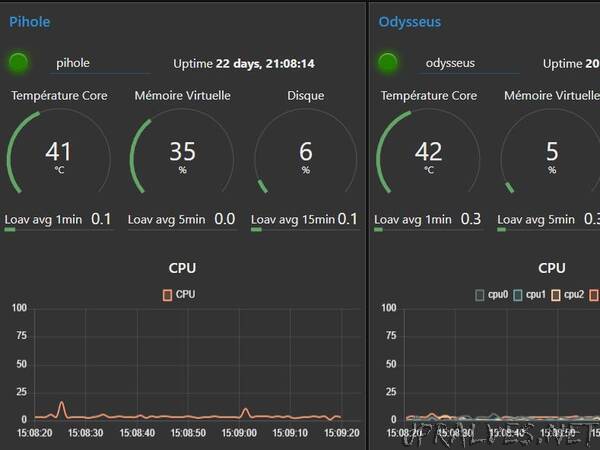
The Raspberry Pi 4 (which is also the MQTT Broker) uses this information through a node red flow to build a nice (in my opinion) dashboard.
The overall project is quite simple and was especially a good way to discover json format, mqtt and basic node red usage.
“Client” Side
On the client side the code running is based on Python 3.
It gathers the following values thanks to psutils lib :
Name of the host
Uptime
Core Temperature
Virtual Memory (%)
Disque usage (%)
Average load (1min, 5min, 15min)
CPU Usage per core (%)
The value are next packed into a json message and published to MQTT broker.
To enable the.py script to run at boot, I had it to my cron tab (@reboot…).
“Server” Side
As previously said the server is running thanks to Node Red. It does the following actions :
Receiving MQTT message
Print if client is connected or not
Decoding Json message
Printing on the dash board the different value (graph, bar plot,…)
Sending an email if the disk usage is over 90%
I used the dashboard nodes and a node called “artless gauges”“