
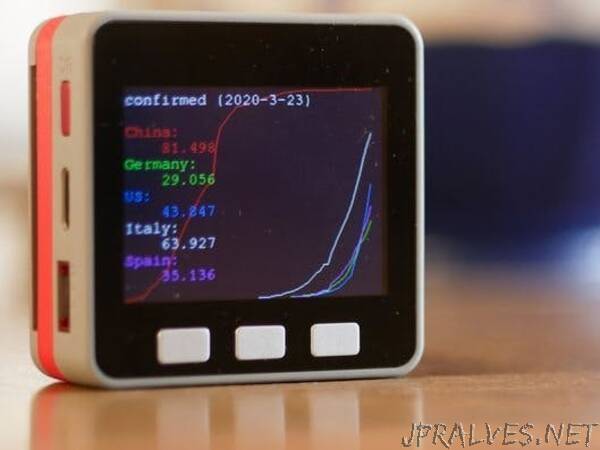
“Using the M5Stack to visualize timeseries data of the Covid-19 pandemic.
Timeseries data of confirmed infections and deaths during the Covid-19 pandemic strongly illustrate the seriousness of the situation.
Many websites or smartphone apps are available to view and compare this data. Interfaces and APIs to current data sets are also available, which makes it possible to evaluate and display the data by yourself.
I was interested in comparing the data of certain countries directly in one graph. So I wrote a software to load and display the data of 5 countries as combined graphs on a M5Stack.”