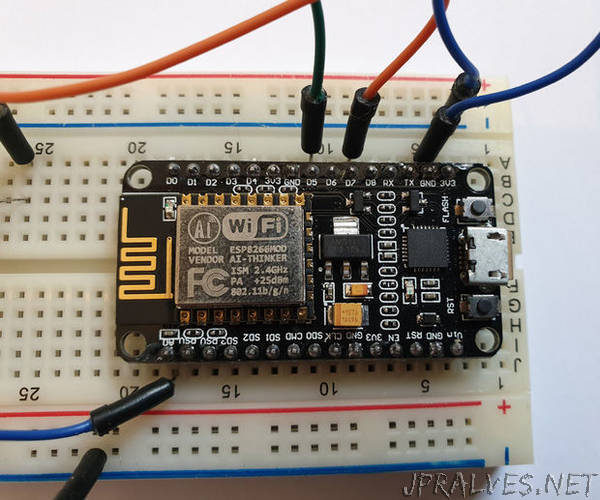
“This Instructable describes how we can use the Node MCU board to collect data from multiple sensors, send this data to a hosted PHP file which then adds the data to a MySQL database. The data can then be viewed online as a graph, using chart.js.
A basic knowledge of PHP and MySQL will be required for this project and you will need access to web hosting with these set up to be able to create and view your own graphs. I’m also assuming you have basic knowledge of using the Node MCU board and uploading sketches to it. (I use the Arduino IDE for this)
As the Node MCU has only one analogue pin we will use multiplexing to be able to read data from multiple sensors. (A number of instructables cover this concept in more detail so I won’t go into that here). In this example I have used two sensors (for light and temperature) but you can change these to whatever you want and add more sensors if required. I have use a light sensitive resistor, a thermistor, two rectifying diodes, a 330 ohm resistor and a 10K resistor and a few jumper wires. The attached Fritzing diagram shows how these are all connected on the breadboard.”
