
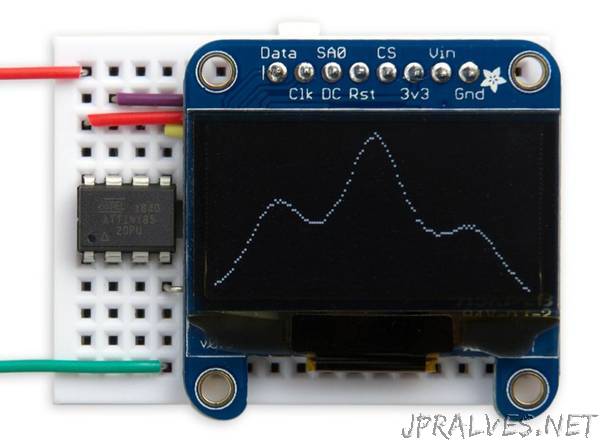
“This project describes a simple routine for plotting a function on a 128x64 I2C OLED graphics display. Unlike most Arduino graphics libraries this routine doesn’t require a RAM buffer, and so will work on any processor down to an ATtiny85:
The routine will work on monochrome 128x64 I2C OLED displays based on either the SSD1306 driver, such as the display available from Adafruit, or the SH1106 driver, used in displays available from Chinese suppliers.
Introduction
My earlier Tiny Graphics Library supported text and graphics plotting on displays using the SH1106 driver chip. Unlike those routines, these simpler routines will also work on the more commonly available displays based on an SSD1306 driver, such as Adafruit’s 128x64 monochrome OLED display.
A restriction with these routines is that they can only plot one value or pixel in each column; in other words, a function. For many applications, such as plotting the value from a sensor against time, this is exactly what you want, so this minimal routine is ideal.
This routine has a second mode which plots histograms rather than points; it still plots only one value per column, but the value is represented by a vertical bar rather than a point. This is useful for showing something like network activity:”