
“Let’s use the LED Matrix of the most recent iteration of the Arduino Uno - the R4 Wifi - to plot the current temperature read from an SHT40
This is a two part tutorial. This part decribes the demo itself and the hardware setup, while part two describes the software.
Demo description
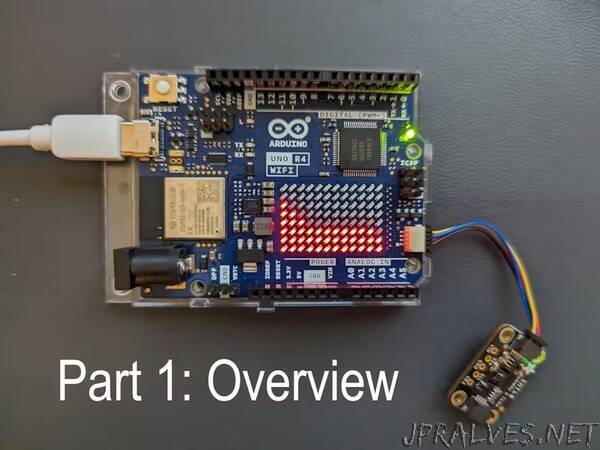
The most recent (as of the time of writing) version of the Arduino UNOfamily the R4, comes in two variants, the R4 Minima and the R4 WiFi. Besides Wifi connectivity, the later also offers a 8x12 LED matrix, which is perfectly suited to plot the historic values from a sensor, similar to the Serial Plotter in the Arduino IDE.
This example is using the temperature signal from a Sensirion SHT40 humidity and temperature sensor, but it should be fairly easy to convert it to any signal you’d like to visualize.
I chose to use the matrix such that the orientation is the same as the text on the Arduino, i.e. with the USB port pointing to the left. The X axis is showing the temperature, and the Y axis is time, with the most recent value being in the rightmost column, and new values “pushing” the older values to the left.
Please note that given the resolution of the X axis of 8 LEDs, we only have limited resolution to show the current value. As such, I defined the following basic parameters:
#1: The baseline value - i.e. the one defining the lowest value in the graph - is based on the temperature measured at startup minus a small percentage
#2: The range displayed is limited to a few degrees only
This way, it should be possible to see changes from blowing on the sensor or by touching it, and to see the signal recover back to a value near zero after a while.
If you’d like to adjust the range or baseline, please check out part 2 of this tutorial, the software deep dive, where we go into more detail how and where these are displayed
Should you start your Arduino in a very cool environment and move to a warmer one or vice versa, it may happen that all values are outside of the displayable range. In that case, simply hit the reset button, and the baseline temperature will be recalculated.
Hardware Setup
This hardware uses the Arduino UNO R4 WiFi. Any sensor from the SHT4x family should work, i.e. SHT40/41/43/45.
In my setup, I was using an SHT40 breakout board from Adafruit, connected via the QWIIC connector for I2C connectivity.
Please note: if you connect your SHT40 to the pin header instead of the QWIIC connector, the I2C port will change from Wire1 to Wire. To learn how to do this, check out part 2 of this tutorial, the software deep dive.
Software Setup
To install the software, you will need to the Arduino IDE, which can be downloaded here. Once installed, you may need to install the board package for the Arduino UNO R4. After this, configure the board and port that the UNO R4 is connected to. I would recommend to run a test sketch to make sure everything works as expected before moving on. If you need help with any of these steps, please check out this ‘Getting Started with UNO R4 WiFi’ tutorial.”