
“How to use a Raspberry PI to chart ambient temperature vs outside temperature. Source code and schematics below.
What you need:
Raspberry PI with an internet connection
DS18B20 temperature sensor (RasPI tutorial at Adafruit)
Account at sen.se to log your values
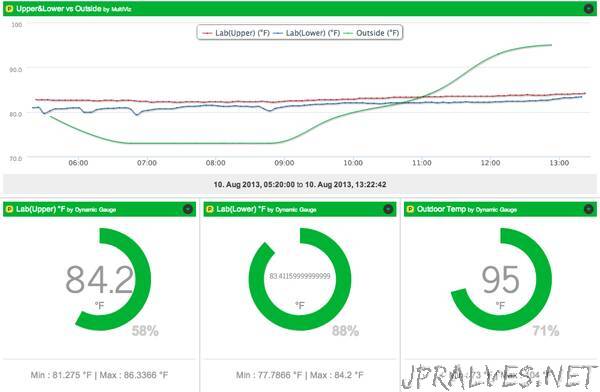
Reading the graph above is pretty obvious. It plots the temperature of the DS18B20 sensor connected to the Raspberry PI vs. the outside temperature that is provided by a local weather forecast feed. Just for fun, we also display Min and Max temperatures (which can be reset).
——-
The graphing is provided by sen.se. The sen.se site offers a lot of flexibility with “the internet of things”. sen.se is free. Sign up and scan the tutorials. The site is well laid out and the tutorials are very straight forward; you’ll be an expert in no time. Basically, you want to create a “channel” for your Raspberry PI by ‘adding a device’. sen.se will give you a 5 digit channel number for your RasPI and a very long passphrase that will be your personal identifier. You will need both of these for the source code below.”