
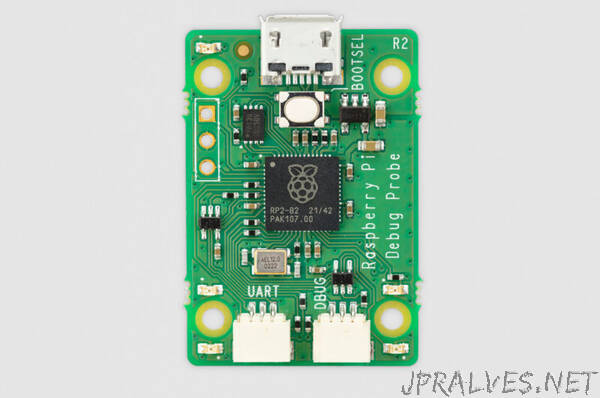
“Ever since we launched Raspberry Pi Pico, and our RP2040 microcontroller, in January 2021, people have been using one Pico to debug programs running on another. Inspired by this trend, today we’re launching the Raspberry Pi Debug Probe, a complete debug hardware solution for Arm-based microcontrollers, powered by RP2040, and priced at just $12.
The Raspberry Pi Debug Probe provides:
- A USB to Serial Wire Debug (SWD) bridge
- A generic USB serial adapter
- Cables to connect to a host computer, and to the debug target
While it has been designed with Raspberry Pi Pico, and other RP2040-based targets, in mind, the Raspberry Pi Debug Probe can be used to debug any Arm-based microcontroller that provides an SWD port with 3V3 I/O.
Bug hunting
If you’re anything like me, you enjoy writing computer programs, but hate tracking down the resulting bugs. But bug hunting is a necessary evil, and if you want to hunt bugs, sooner or later you’re going to need a debugger. While most debuggers offer a common set of basic capabilities (single stepping, breakpoints, inspection of variables and memory), these capabilities are provided in different ways depending on your choice of language and operating environment.
Perhaps you’re using a high-level interpreted programming language, like Python, where debug capabilities are built directly into the runtime environment. Or perhaps you’re using a low-level compiled programming language, like C, but your program is running under an operating system, like Linux; here, a debugger like gdb, often running on the same machine, can interact with your program as it runs, to provide these same capabilities.
But what if your C program is running directly on the processor, without an operating system (this is often referred to as bare metal operation)? What if you’re writing an operating system? In this case, you’ll need a way to access the debug capabilities built into the processor itself. And that’s where a debug probe comes in.
What is a debug probe?
All modern Arm-based microcontrollers, including RP2040, implement Arm’s CoreSight debug architecture. Each processor core, like the Cortex-M0+ used in RP2040, provides an Access Port (AP) which can be used to single step, set breakpoints, observe the values of processor registers, and access memory and peripherals via the processor’s bus interface.
The microcontroller itself provides a Debug Port (DP), which is connected externally to pins on the package, and internally to each AP in the system. RP2040 exposes its DP via a low-pin-count Serial Wire Debug (SWD) port: by talking the SWD protocol over this port, a host computer can control each core’s AP, in order to debug a program running on the core.
A debug probe provides a bridge between USB and the SWD protocol. While not strictly required if the host computer is a Raspberry Pi (you can wire up the target’s SWD port directly to the GPIO header on a Raspberry Pi), it’s much more convenient to connect via USB. And if you’re using a PC or Mac, USB is your only option.
The Raspberry Pi Debug Probe exposes the SWD signals on a three-pin JST connector, conforming to the Raspberry Pi Debug Connector Specification. We provide adapter cables to connect without soldering to breadboard, and to the debug connector on Raspberry Pi Pico H and WH.
Arm has helpfully standardised the protocol used to communicate over USB between a host computer and a debug probe. The Raspberry Pi Debug Probe conforms to this CMSIS-DAP standard, and so will work out of the box with many existing debug software platforms, including our favourite, OpenOCD.
Serial communication
We often want to establish a serial console connection between a microcontroller target and a host computer. This provides a simple way to interact with software running on the target, and to retrieve logging and other diagnostic data. If the host computer is a Raspberry Pi, then you can use one of the UART peripherals exposed via the GPIO header. But if you’re using a PC or Mac, it’s very unlikely that you have access to a built-in serial port.
The Raspberry Pi Debug Probe functions as a USB serial adapter, over the same USB connection as the SWD bridge. It exposes the UART signals on a second three-pin JST connector, again conforming to the Raspberry Pi Debug Connector Specification.
For users who do not require debug functionality, the Raspberry Pi Debug Probe’s low price makes it a cost-effective alternative to other USB serial adapters. It has largely replaced the once-ubiquitous FTDI cable as our adapter of choice here at Pi Towers.
Credits
The Raspberry Pi Debug Probe project was driven by James Adams, who originated the concept and designed the hardware. Jonathan Bell wrote the software, taking inspiration from the DapperMime project. John Cowan-Hughes designed the plastics, and the rather neat packaging mechanics. Jack Willis did the packaging artwork. Rose Nott led on supply chain. Alasdair Allan and Andrew Scheller worked on the documentation.”