
“Story
In this project, we will build a 2.4GHz Wlan scanner using the nRF24L01 radio board. In this project, the output delivers all the interference and information in the scanned area in the form of ASCII codes. In the project of making this scanner, we will use Arduino Nano as a processor. In the second part of this project, we will add an OLED display and display the scanned values in graphs and graphs. With the nRF24 module, we can scan and view the entire 2.4GHz network. This helps us to check the status of the signals in the network. Visit CiferTech for more tutorials, and be sure to follow my Instagram page to support me. ^-^
nRF24L01
This module is a transceiver, meaning it does both send and receive. These modules are very cheap on price with small size, the operating voltage of this module is from 1.9 to 3.6 volts, MOSI, MISO and SCK pins are the SPI pins of the module. Must be connected to SPI protocol pins in Arduino. The CSN and CE pins are for setting the module to active mode and switching between command mode and data transfer. These two pins can be attached to any digital pin on the Arduino. The IRQ pin is an interrupt pin and does not need to be connected.
Some of the specifications of these modules are as follows:
Power consumption when sending data is about 12 mA.
Range, if used outdoors with antenna, can reach up to 1000 meters
Each module can communicate with up to 6 other modules.
Use the 2.4 GHz band.
You can send 1 to 25 bytes of raw data at a speed of 1 MB.
Interference in the 2.4 GHz network band
There are many devices that operate in the 2.4GHz range, such as; Telephone, Bluetooth, WiFi, car alarm, microwave are all in this range that with this project we will be able to measure and display these values. It is not usually very difficult to find interference. Products are coming to market that act as spectrum analyzers and use a standard USB interface to a laptop, meaning that the interference source can be easily used with an antenna to find interference.
Oled 0.96 SSD1306
OLED displays are commonly used in IoT and other embedded projects to display text and different amounts. These modules come in a variety of sizes depending on the type of the driver, one of the most popular being the SSD1306 These types of OLEds are usually made in 0.96 and 1.3 inch sizes. Also, the OLED communication protocol is I2C. The light emitting diode (OLED) display that we will use in this tutorial is the SSD1306, a 0.96-inch monochrome display with 128.64 pixels as shown in the figure below. The OLED display does not require backlighting, which results in a very good contrast in dark environments. Also, its pixels consume energy only when turned on, so the OLED screen consumes less power than other monitors.
Arduino
The Arduino board series is one of the most popular development boards among embedded engineers, which can be provided in various models such as Micro, proMini, Nano, Uno, as well as Mega, the core of these popular boards is the AtMega328 series. Arduino is an open source hardware and software platform. As mentioned earlier, the Arduino platform includes an open source single-control microcontroller that forms part of the Arduino hardware. In addition, the Arduino platform includes an Arduino IDE software designed to program for Arduino boards and a software bootloader that loads on the microcontroller.
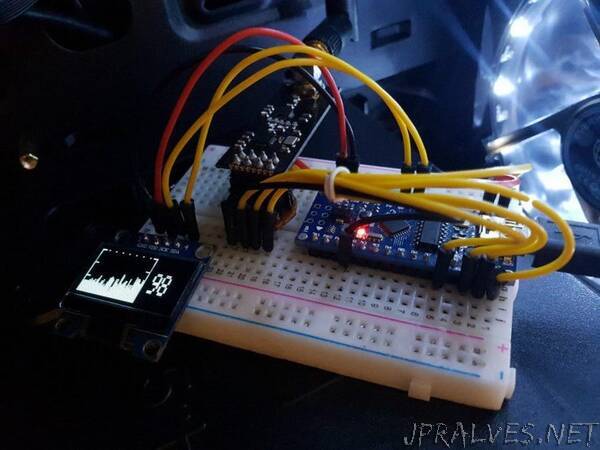
Project working method
The activity of the nRF24 RF radio board is transmitted to the Arduino board via the serial interface and displays any type of activity in ASCII code. Domains are displayed in different channels with the help of a simple mapping. In this project, the 2.4GHz network scanner even shows the interference of microwaves and wireless cameras. Of course, you may be wondering what is the difference between this scanner and packet monitors ?! In response, I have to mention that in the monitor pack, it only monitors the 14 channels available for WiFi networks, but in this project, we can detect and actually see any frequency in the 2.4 range. In the second part, we will deal with this issue more. In the following, we will display these values in the form of graphs using the OLED display. The graph values are based on the nRF power consumption at the moment of scanning, which in this scenario is directly related to the input data.
Items needed
- Arduino
- NRF24L01
- Oled 0.96”