
“This Instructable is competing on contest: “Raspberry Pi”. If you like it, please give your vote by clicking at the above banner. Thanks a lot! ;-)On my previous tutorial, Python WebServer With Flask and Raspberry Pi, we learned how to interact with the physical world, thru a web front-end page, built with Flask. So, the next natural step is collect data from the real world, having them available for us on a webpage. Very simple! But, what will happen if we want to know what was the situation on the day before, for example? Or make some kind of analyzing with those data? In those cases, we must have the data also stored in a database.
In short, on this new tutorial, we will:
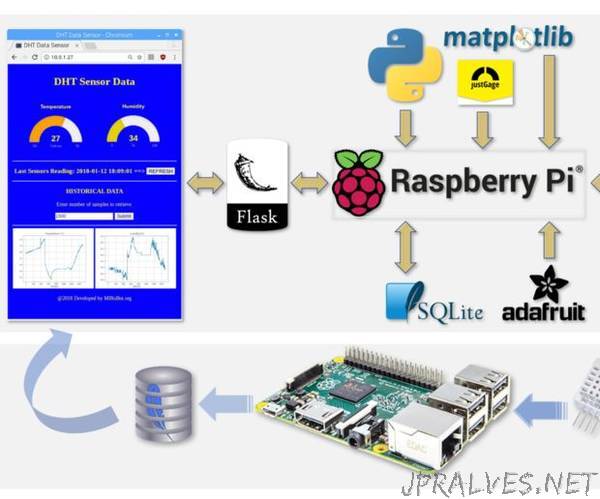
Capture real data (air temperature and relative humidity) using a DHT22 sensor;Load those data on a local database, built with SQLite;Create graphics with historical data using Matplotlib;Display data with animated “gages”, created with JustGage;Make everything available online through a local web-server created with Python and Flask;”